Prescription Drug Spending
Issue Summary
Patients, private payers, and the federal government (including Medicare, Medicaid, and the Department of Veterans Affairs) all help pay for prescription drugs—and the amount of money spent on both brand-name and generic prescription drugs has increased dramatically over the past 2 decades. For example, retail prescription drug spending was estimated to account for nearly 11% of total personal health care services spending in the United States in 2022 (up from about 7% in the 1990s).
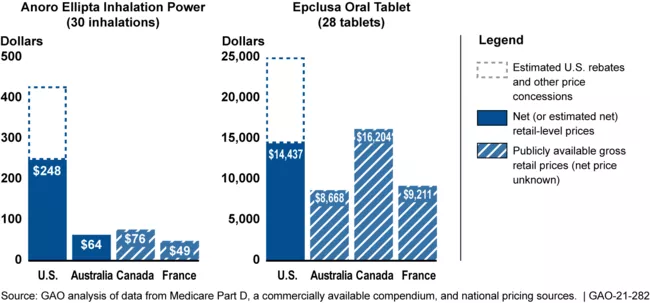
The U.S. spends more than other countries for prescription drugs. For example, in 2020, estimated retail prices for 20 selected brand-name prescription drugs were more than 2 to 4 times higher than prices in Australia, Canada, and France. Consumers’ out-of-pocket costs for prescription drugs also varied more within the U.S. and Canada, where multiple payers have a role in setting prices and designing cost-sharing for consumers, and where not all consumers have prescription drug coverage.
Estimated Retail Prices for 2 Prescription Drugs for Selected Countries, 2020
Image

There are several factors that affect prescription drug prices in the United States.
For instance:
- Competition. Competition has a major effect on drug prices. There have consistently been about 300 reported mergers and acquisitions among drug companies every year from 2006 to 2015. Consolidation among drug companies, including mergers and acquisitions that result in fewer companies producing and marketing drugs, may reduce competition and lead to higher prices. In addition to companies consolidating, market pressures have driven some drug companies to move toward specialization in certain therapeutic areas—which also reduces competition. Additionally, brand-name companies producing drugs under patent or exclusivity protection have pricing power. When determining prices for new drugs, they can consider factors like the availability and price of alternatives and the potential market size. Generic drugs, on the other hand, compete with the brand-name or other generic versions of the same drug primarily through price—and the prices of generic drugs generally fall as additional manufacturers enter the market.
- Medicare Part D. Medicare is the largest public payer for drugs, and it has seen high spending and large price increases for some drugs. Medicare Part D is a voluntary outpatient prescription drug program for self-administered drugs. Part D expenditures have increased substantially in recent years, with rebates and discounts from manufacturers and others moderating this increase. Specifically, gross Part D expenditures (the amount pharmacies received from plans and beneficiaries) increased 20% from 2014-2016. Once rebates and other concessions were taken into account, net expenditures increased 13% during this same period.
- Pharmaceuatical rebates. Pharmaceutical manufacturers paid plan sponsors $48.6 billion in rebates in 2021, which accounted for 23% of the $210.6 billion in 2021 Part D gross expenditures. Rebates may lower Medicare drug spending, as plan sponsors use rebates to lower premiums for beneficiaries and Medicare plan sponsor payments are based on drug costs after rebates. However, rebates do not lower individual beneficiary payments for drugs, as these are based on the gross cost of the drug before accounting for rebates. Of the 100 drugs with the most rebates in 2021, beneficiary payments were 4 times greater than plan sponsor payments for 79 drugs, after accounting for rebates—$21 billion compared to $5.3 billion. Medicare should monitor the effects of rebates on the drugs covered by the plan, as well as on Medicare and beneficiary spending.
- Generic drugs. While most Medicare Part D spending and rebates were for brand-name drugs, generic drugs represented most of the prescriptions that Medicare beneficiaries filled. Generic drug prices declined overall under Medicare Part D between 2010 and 2015 (though some established generic drugs had extraordinary price increases of 100% or more). Medicare Part B covers drugs administered by—or under the close supervision of—a physician in an outpatient setting. Part B drug expenditures increased at an average annual rate of 4.4% from 2007 to 2013 (from $16.2 billion to $20.9 billion). This growth was driven primarily by new Part B drugs—total expenditures for these drugs increased steadily from 2007 to 2013 (from $0.1 to $5.9 billion) as the number of new drugs and the number of beneficiaries receiving them increased. Beneficiaries’ share of the cost of these drugs ranged from $1,900 to $107,000 per drug in 2013.
- Drug advertising. Drug manufacturers advertise to encourage consumers to ask their doctors for specific medications. Medicare Part B, Part D, and beneficiaries spent $560 billion on drugs from 2016 through 2018, $324 billion of which was spent on drugs with direct-to-consumer advertising. Among the top 10 drugs with the highest Medicare Parts B or D expenditures, 4 were also among the top 10 drugs in advertising spending in 2018: Eliquis (blood thinner), Humira (arthritis), Keytruda (cancer), and Lyrica (diabetic pain).
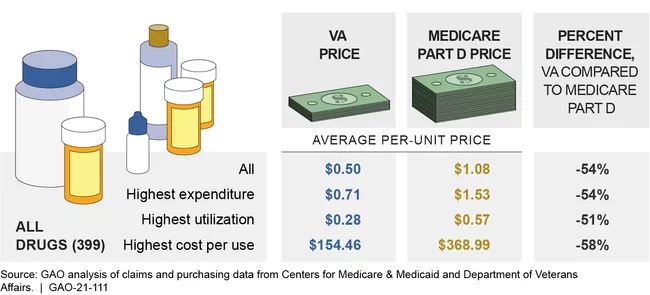
- Discounts. Federal programs may pay different prices for the same drug. For example, VA paid, on average, 54% less per unit for a sample of 399 brand-name and generic prescription drugs in 2017 than Medicare Part D (even after accounting for rebates and price concessions in the Part D program). This may partly be due to VA’s access to certain discounts (which are defined by law) that are not available to Medicare Part D plans. But giving such discounts to all federal programs may not produce a net benefit. If a large federal program with many beneficiaries became eligible for the discounts available to other programs, manufacturers might choose to raise prices for these other programs to offset the discounts.
Average Prices Paid by VA and Medicare Part D for Selected Drugs, 2017
Image


