K-12 Education: Student Population Has Significantly Diversified, but Many Schools Remain Divided Along Racial, Ethnic, and Economic Lines
Fast Facts
Schools remain divided along racial, ethnic, and economic lines throughout the U.S.—even as the K-12 public school student population grows more diverse.
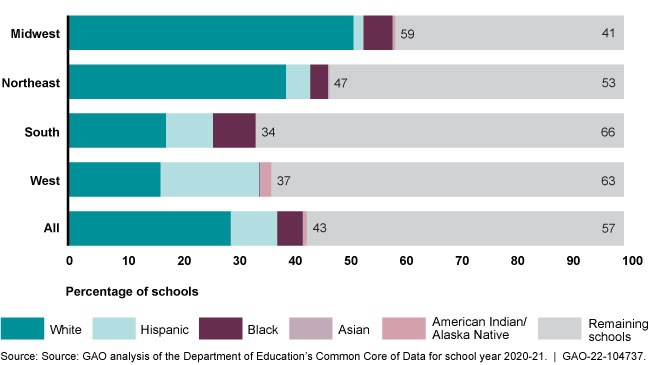
During the 2020-21 school year, more than a third of students (about 18.5 million) attended schools where 75% or more students were of a single race or ethnicity. Because district boundaries often determine which school a student can attend, school district boundaries can contribute to continued division along racial/ethnic lines.
We also found that new school districts that seceded from existing districts usually had higher percentages of white and Asian students than districts they left.
Percent of Schools That Are Predominantly (75% or more) Same-Race/Ethnicity, by Region, in School Year 2020-21

Highlights
What GAO Found
As the K-12 public school student population grows significantly more diverse, schools remain divided along racial, ethnic, and economic lines throughout the U.S. These divisions span school types, regions, and community types (urban, suburban, and rural). More than a third of students (about 18.5 million) attended a predominantly same-race/ethnicity school—where 75 percent or more of the student population is of a single race/ethnicity—according to GAO's analysis of Department of Education data for school year 2020-21. GAO also found that 14 percent of students attended schools where 90 percent or more of the students were of a single race/ethnicity.
Percent of Public K-12 Students Attending School Where 75 Percent or More of the Students Are of Their Own Race/Ethnicity

Because diversity within a school is generally linked to the racial/ethnic composition of the district, school district boundaries can contribute to continued divisions along racial/ethnic lines. For example, about 13,500 predominately same-race/ethnicity schools (about 14 percent of all public K-12 schools) are located within 10 miles of a predominately same-race/ethnicity school of a different race/ethnicity; of these schools, 90 percent have a different same-race/ethnicity pair in a different school district.
GAO's analysis of 10 years of Education data shows that district secession—a process by which schools sever governance ties from an existing district to form a new district—generally resulted in shifts in racial/ethnic composition and wealth. Compared to remaining districts, new districts had, on average, roughly triple the share of White students, double the share of Asian students, two-thirds the share of Hispanic students, and one-fifth the share of Black students (see figure below). New districts were also generally wealthier than remaining districts. Specifically, the percentage of students eligible for free or reduced price lunch—a proxy for poverty—was half that of the remaining districts.
Racial/Ethnic Composition of New and Remaining Districts One Year after District Secession

Why GAO Did This Study
It is widely recognized that a history of discriminatory practices has contributed to inequities in education, intertwined with disparities in wealth, income, and housing. Because district boundaries typically define the schools a student can attend and public education is partially funded by local property tax revenues, lower-income communities generally have fewer resources available for schools. For example, GAO previously reported that students who are poor, Black, and Hispanic generally attend schools with fewer resources and worse outcomes.
GAO was asked to examine the prevalence and growth of segregation in K-12 public schools. This report examined the extent of (1) racial, ethnic, and economic divisions in K-12 public schools, and (2) district secession and any resulting student demographic shifts.
To determine the extent of divisions along racial, ethnic, and economic lines in schools, GAO analyzed demographic data from Education's Common Core of Data by school type, region, and community type, covering school years 2014-15 to 2020-21, the most recent available data since GAO last reported on this topic in 2016.
To identify the number and location of districts that seceded from school year 2009-10 through 2019-20, GAO analyzed and compared school district data from the Common Core of Data for the new and remaining districts in the year after secession to identify and describe any differences in demographic and socioeconomic characteristics.
GAO incorporated technical comments from Education, as appropriate.
For more information, contact Jacqueline M. Nowicki at (617) 788-0580 or nowickij@gao.gov.
